We’ve collected the best free templates released this year for marketing, ecommerce, analytics, and more.
You can easily copy these reports and use them with your own data. If you need help figuring out how to copy a template there’s a guide at the end explaining the process.
If you found this article helpful, please consider using our affiliate link for Supermetrics – they make it incredibly easy to connect all your data to Data Studio
Quick Reference Guide:
- Search Templates
- Google Ads Templates
- Social Ads and Paid Media Templates
- Google Analytics Templates
- Ecommerce Templates
- How to copy a free template
Search Templates
At this time there is only one decent free search console template available for free. I’ll post more as they become available.
All-in-one Search Console Template by Data Bloo
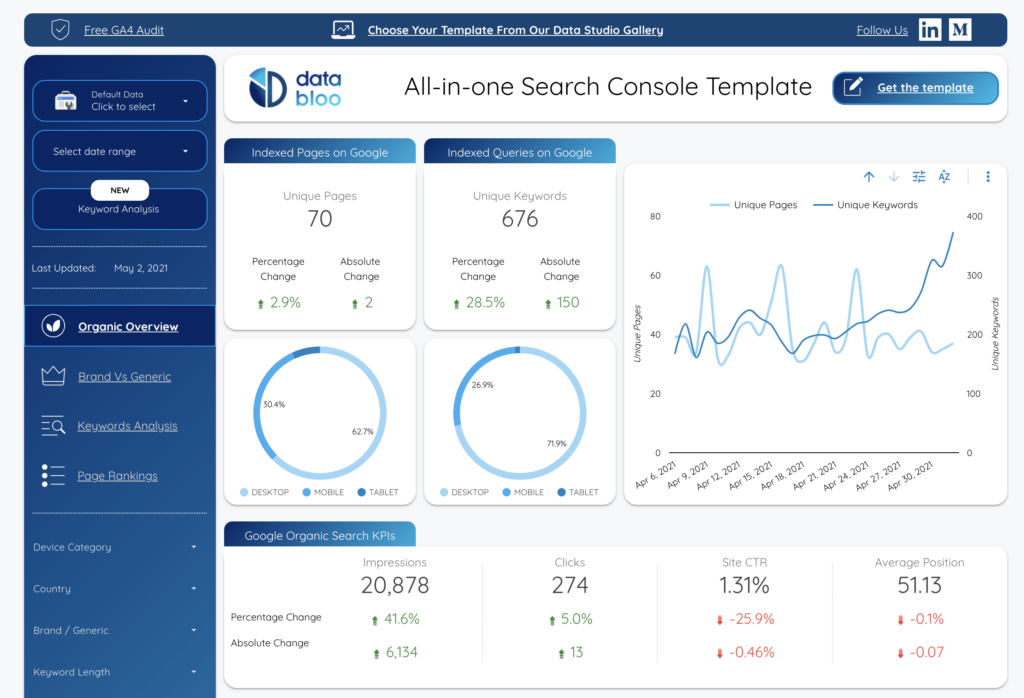
Summary: As of 2021 this is the best all-in-one option available for free. It includes organic search results and keyword breakdown along with page rankings. All presented with nice clean visuals. One important note is that this report can’t be copied for free, but you can use it to analyze your own data and to guide your own dashboard visualizations.
Data Sources: Google Search Console
Time to setup: <5 minutes
Ease of setup: Easy – just make sure you already have a Google search console account
Google Ads Templates
Google Ads Monitoring Report by Search Foresight
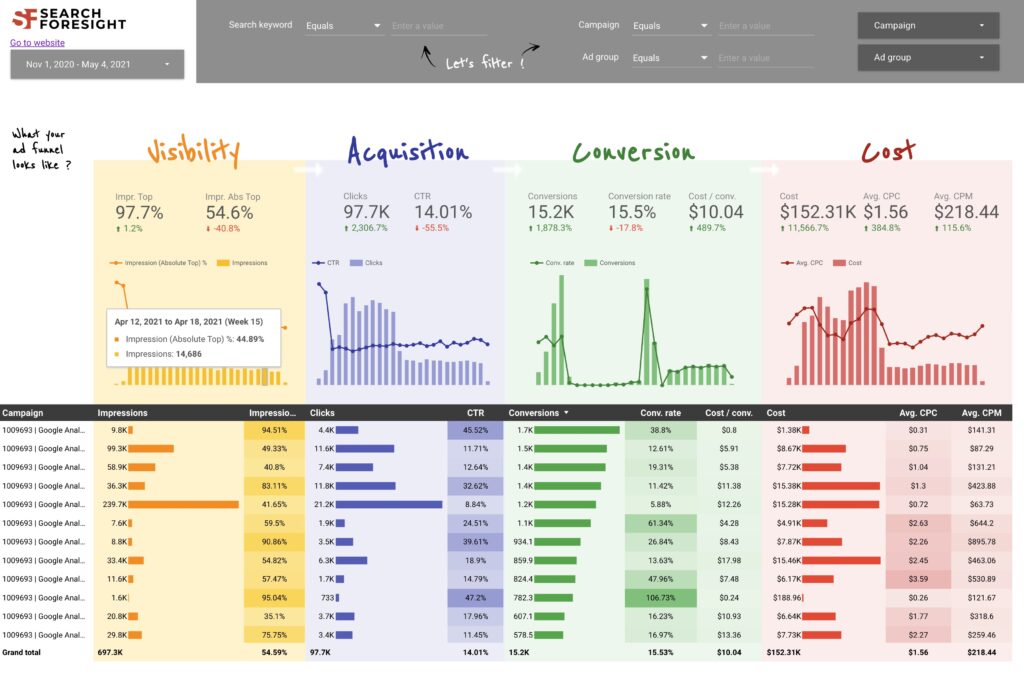
Summary: Intuitive and attractive breakdown of ad performance that segments KPIs into 4 categories: visibility, acquisition, conversion and cost. Allows you to filter by specific campaigns and do keyword/campaign/ad group search filtering.
Data Source: Google Ads
Time to setup: 30 minutes
Ease of setup: Medium – you will need to reconnect using your own Google Ads account
Social Ads and Paid Media Templates
Paid Channel Mix Report by Supermetrics
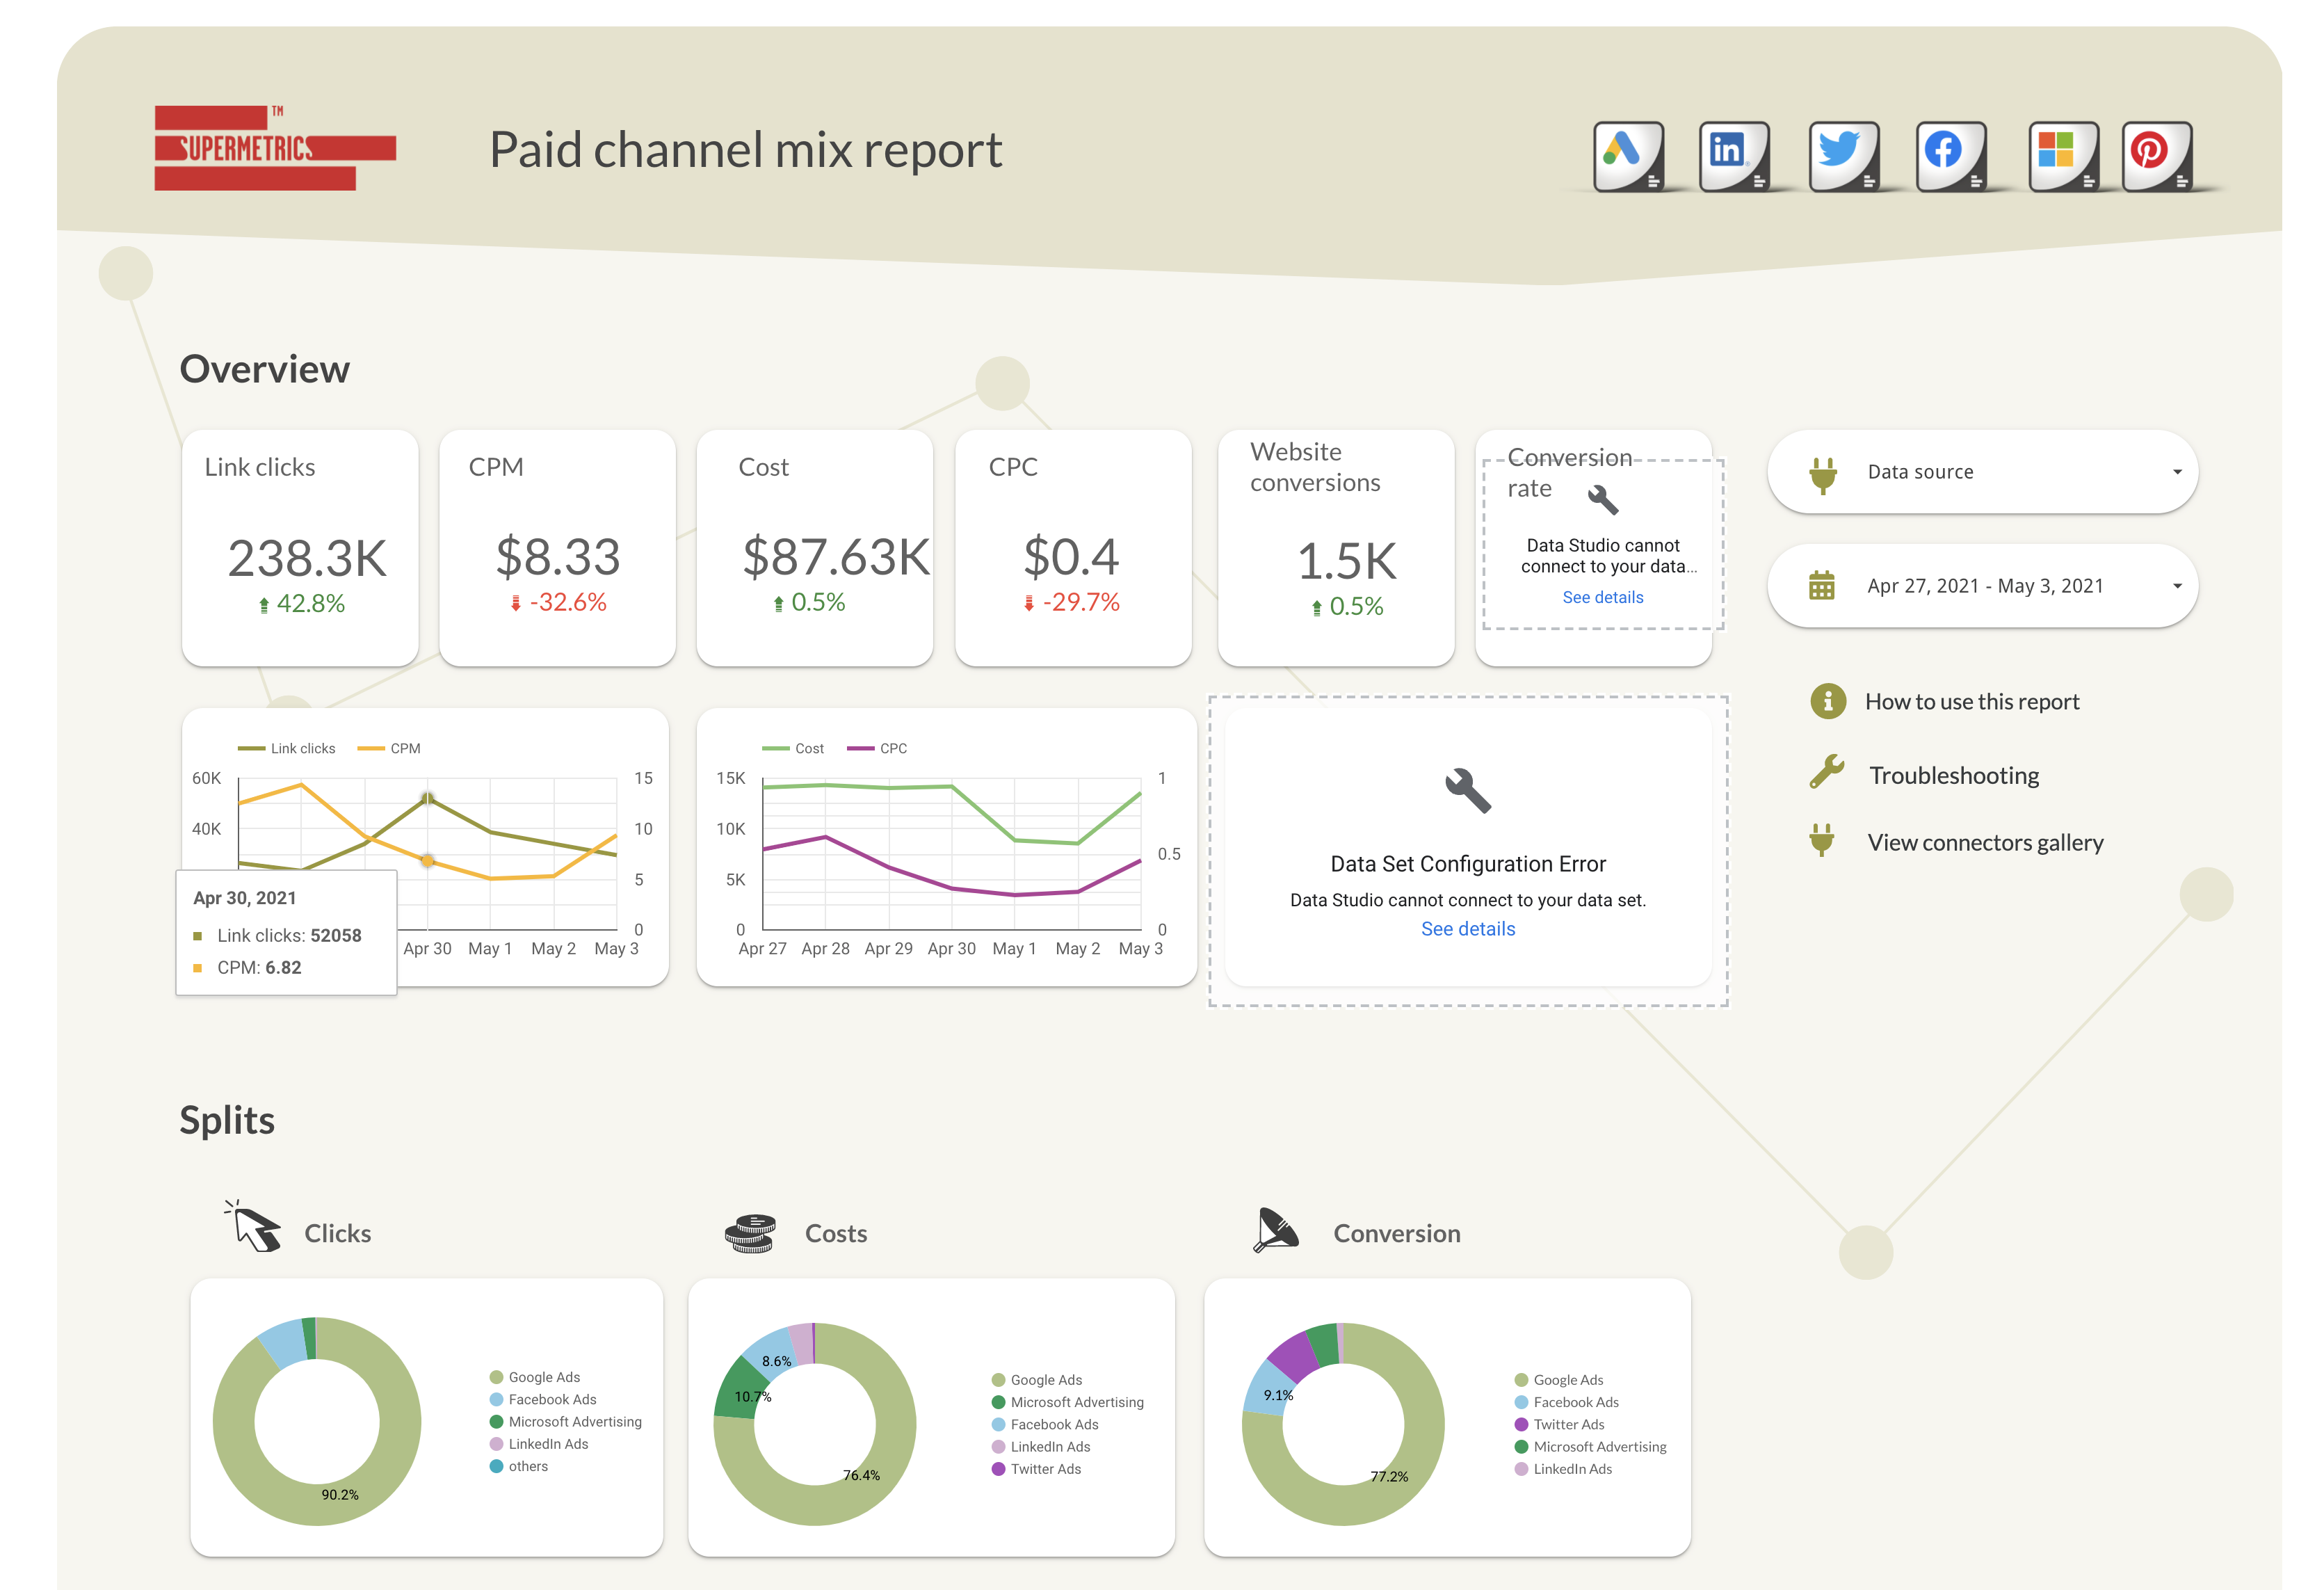
Summary: Supermetrics is a product that makes it easier to connect to multiple ad platforms and combine the data into one report. Their paid channel mix report gives you an idea of how you can combine data from google, linkedin, twitter, facebook, bing and pinterest into one single report.
Data Source: supermetrics, google ads, linkedin ads, twitter ads, facebook ads, bing ads and pinterest
Time to setup: <1 hour
Ease of setup: Medium – you will need to connect multiple accounts to Supermetrics but they have folks to help you get started.
Facebook Ads Overview by AnalyticsHelp.io
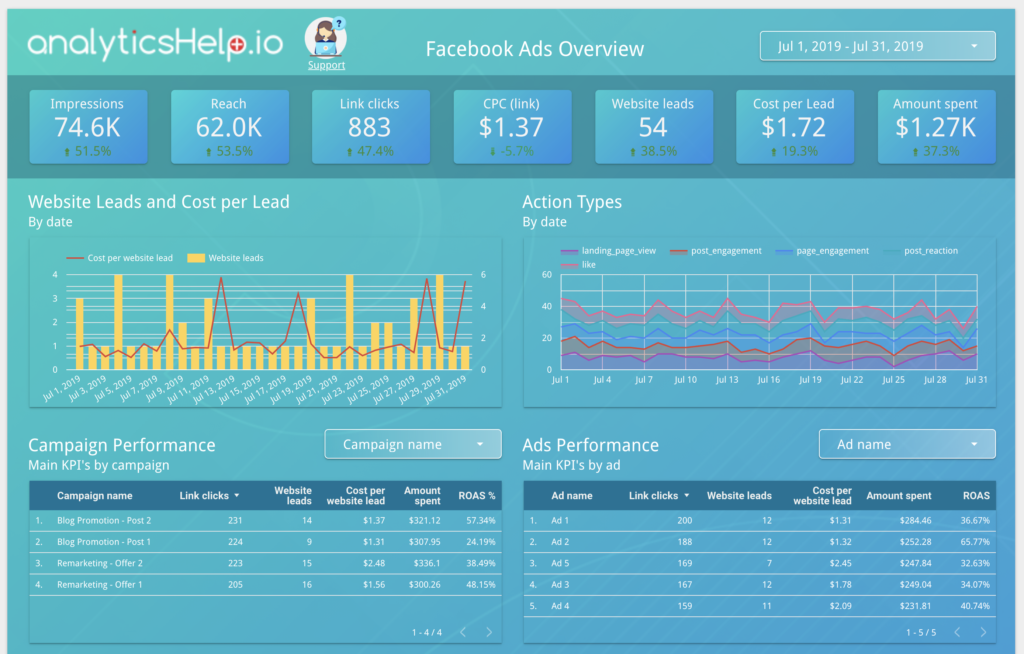
Summary: If you have your Facebook Ads data in a CSV or Google Sheet this template may be a good option for you. You can duplicate their report and map your own metrics to the ones they are currently using. This is a somewhat more advanced process when compared to using an existing connector but may be worth considering if you rely on a spreadsheet software.
Data source: google sheets, CSV, Facebook Ads
Time to setup: 2-3 hours
Ease of setup: Hard
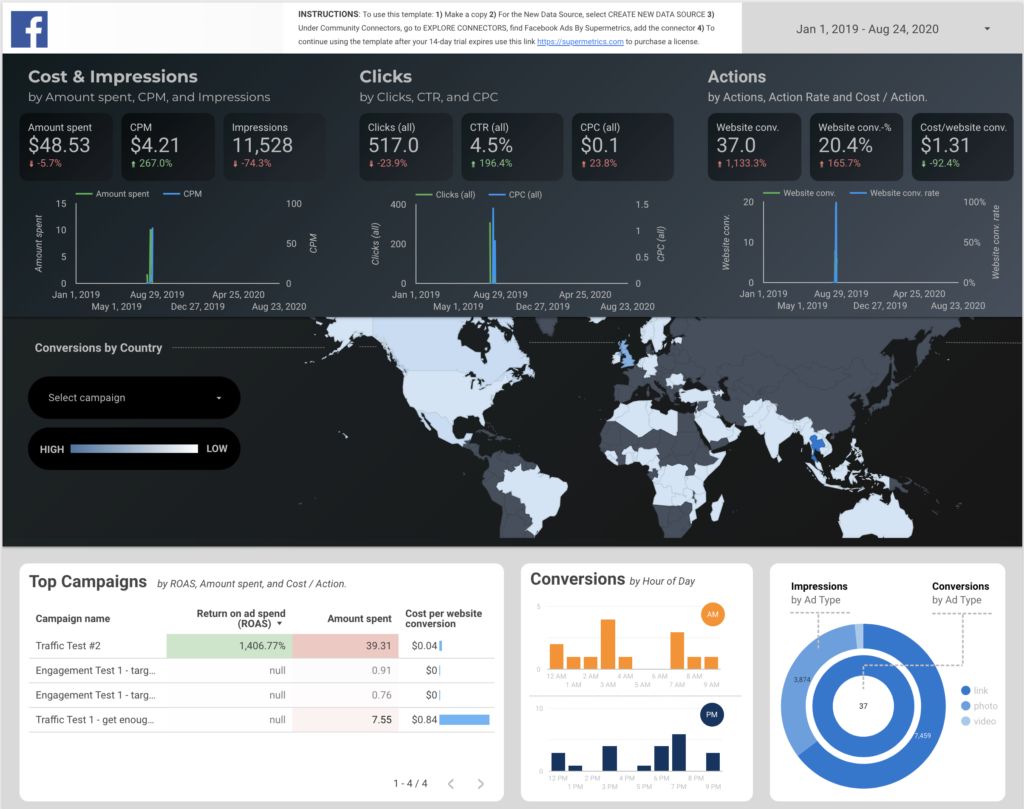
Summary: A template that I built for the Supermetrics Facebook Ads connector. The goal is actionable top-level metrics wrapped in a beautiful package. You’ll need a Supermetrics account to use it but you could also just copy the template design and visuals to use with your own data or another connector.
Data Source: Supermetrics, Facebook Ads
Time to setup: <1 hour
Ease of setup: Medium
Google Analytics Templates
Blue World by Michael Howe-Ely
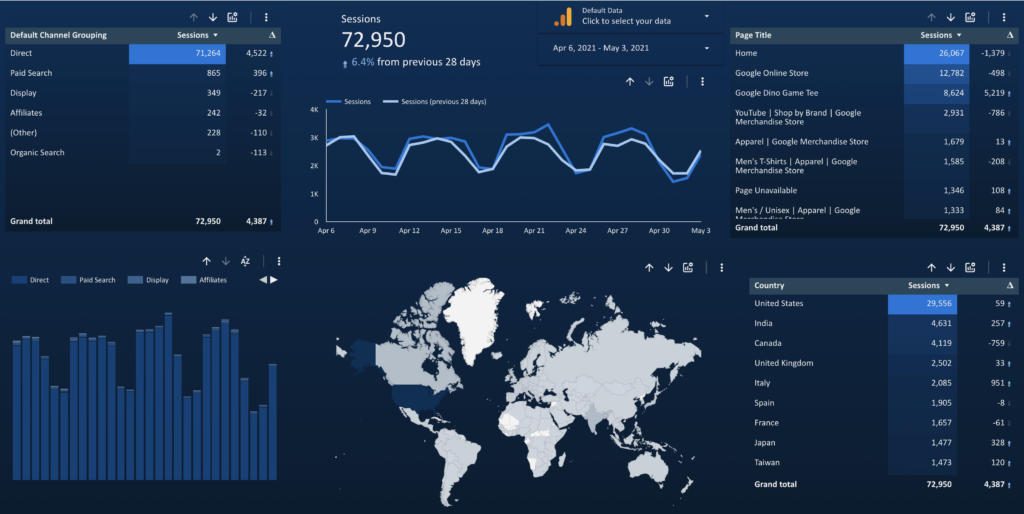
Summary: Michael has built a beautiful set of visualizations and insights that can easily be used for your own Google Analytics data. It’s a great starting point if you need some inspiration for your charts or some help with your visual design.
Data Source: Google Analytics
Time to setup : 5 minutes
Ease of setup: Easy
Acquisition EEG by Josh Cottrell
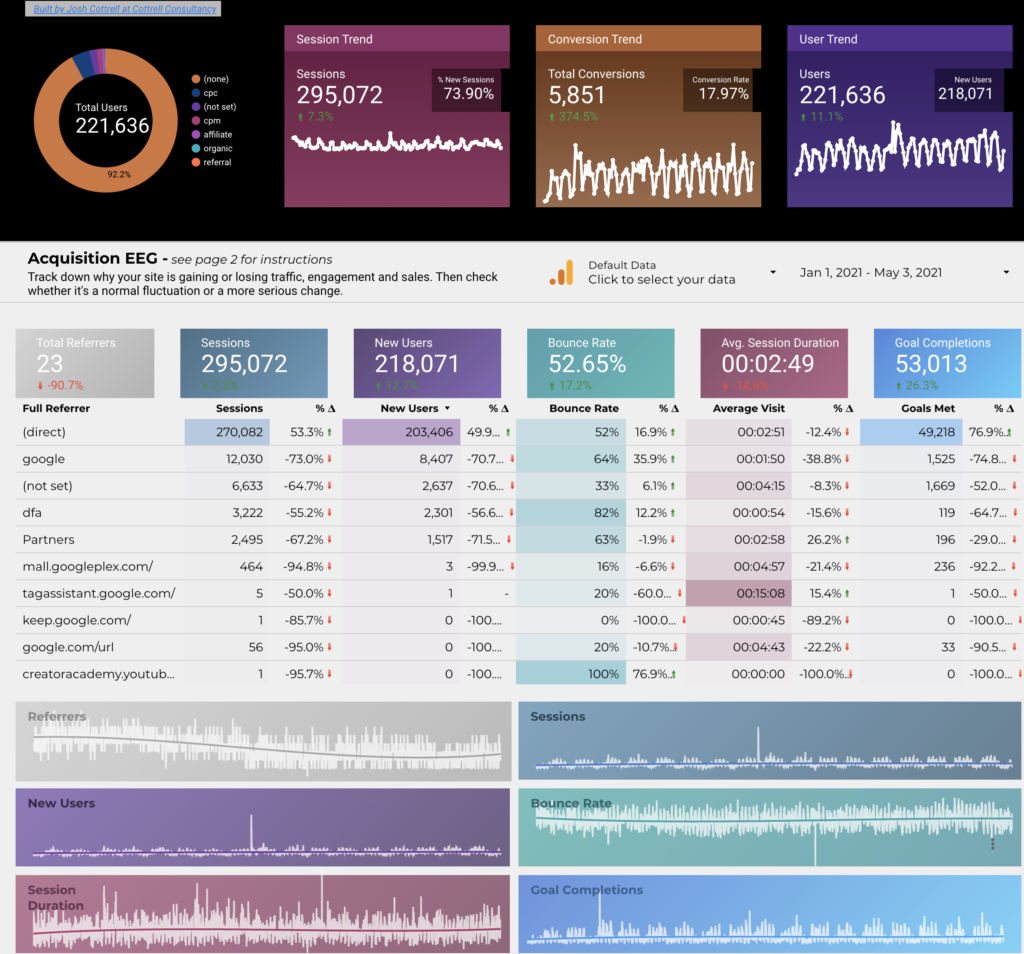
Summary: This report is designed to let you quickly see your top level performance and how you’re trending over time. It’s intended to let you easily see if a change is a normal fluctuation or a meaningful change.
Data Source: Google Analytics
Time to setup: 5 minutes
Ease of setup: Easy
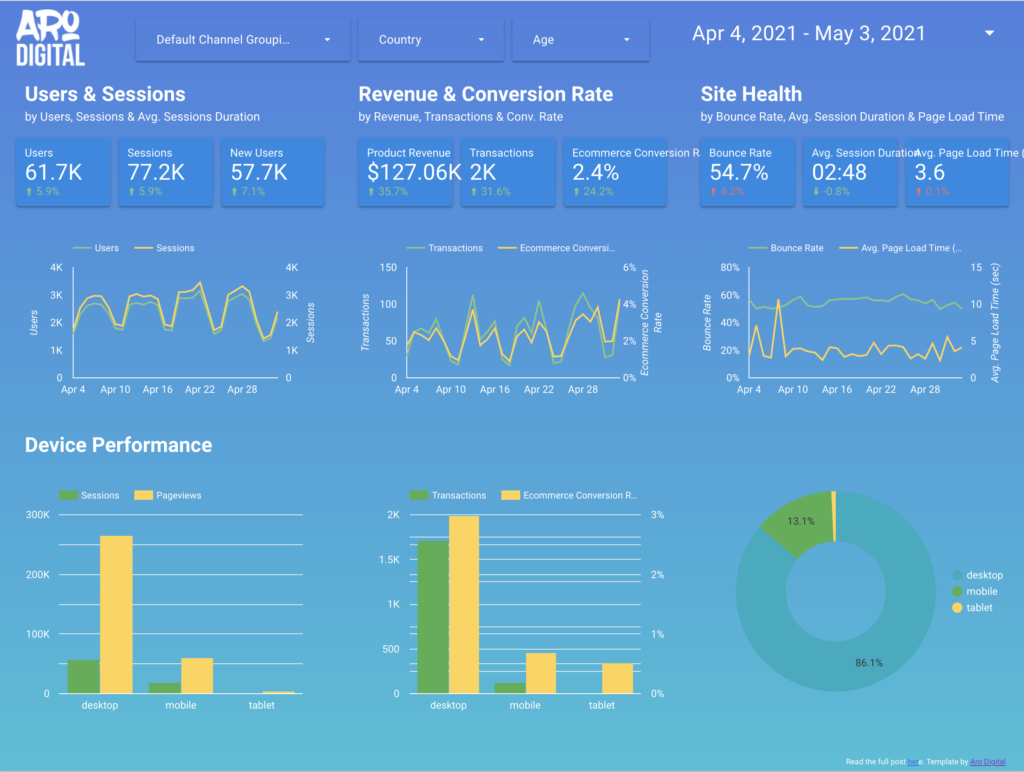
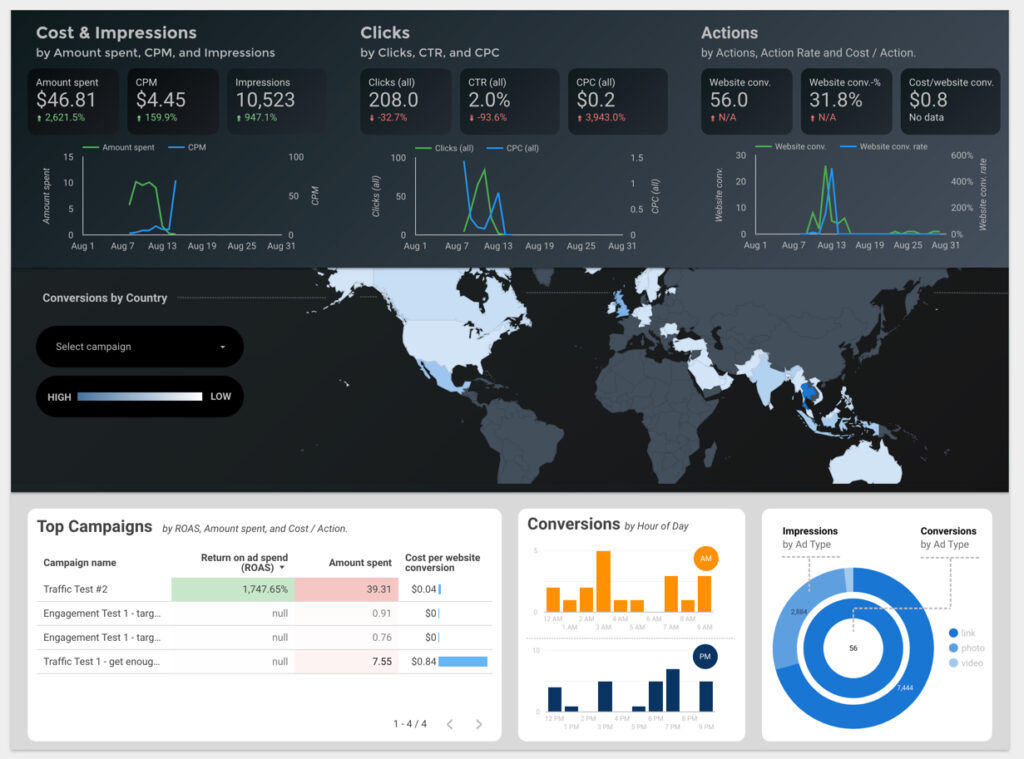
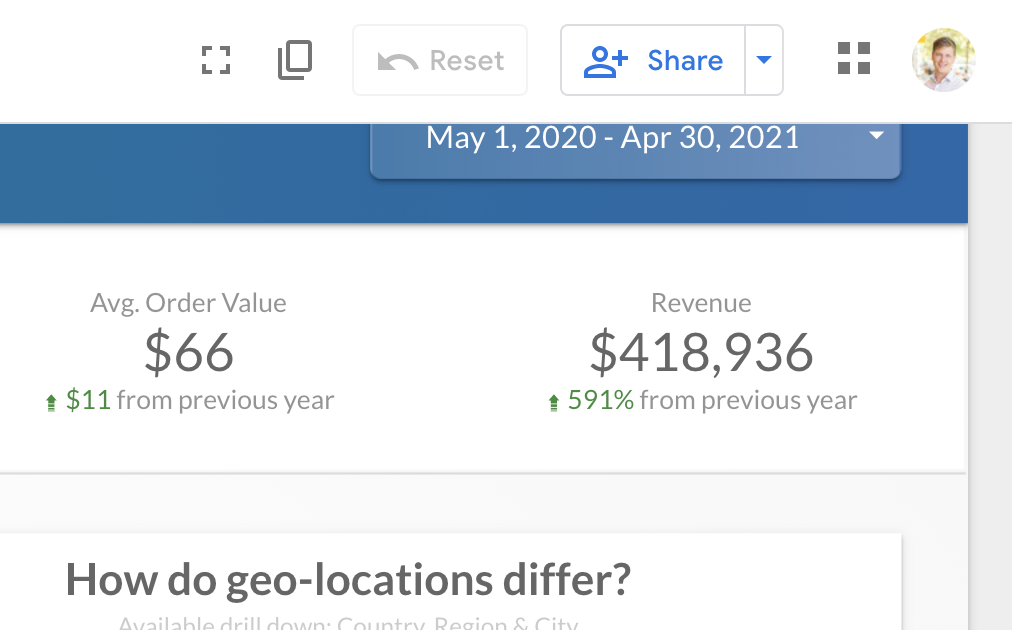
Summary: A fun little Google Analytics reports for those that are tracking conversions and conversion value. It highlights the revenue/transactions/conversion rate. This template does also pull data form Google Ads and Search console so it may not be the ideal match if you’re ONLY using Google Analytics.
Data Source: Google Analytics, Google Ads, Google Search Console
Time to Setup: <30 minutes
Ease of Setup: Easy/Medium
Ecommerce Templates
Merchandise Store Template by Google
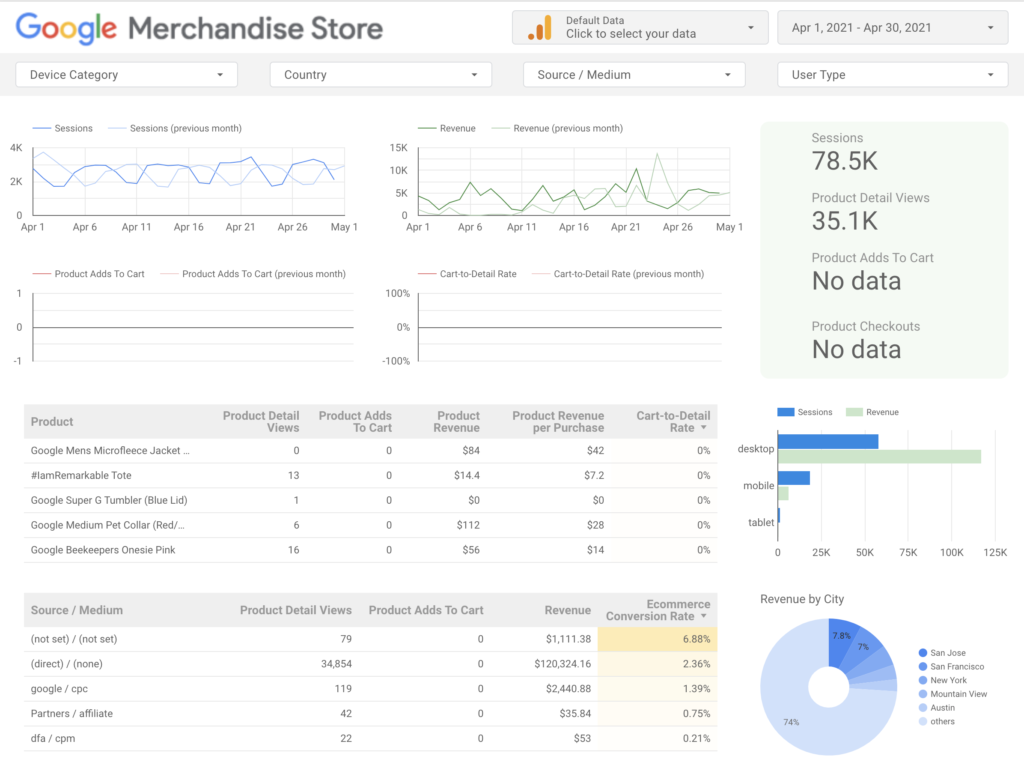
Summary: Google’s default ecommerce template that uses data from Google Analytics
Data Source: Google Analytics
Time to Setup: 5 minutes
Ease of Setup: Easy
Digital Analytics for Ecommerce by Kjetil Grosland
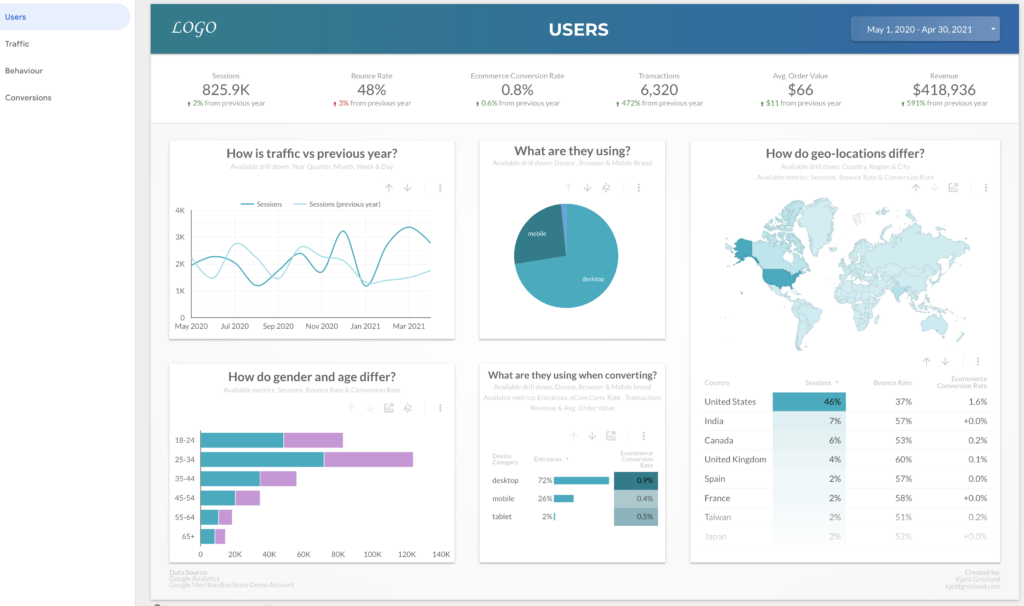
Summary: Another great eCommerce template leverage Google Analytics data. This option from Kjetil has a nice layout and a more pleasing overall design. It’s also broken down into categories to help guide users through their data: Users, Traffic, Behavior and Conversions.
Data Source: Google Analytics
Time to Setup: 30 minutes
Ease of Setup: Easy/Medium
Great option but not free: Ecommerce Revenue Template by Data Bloo
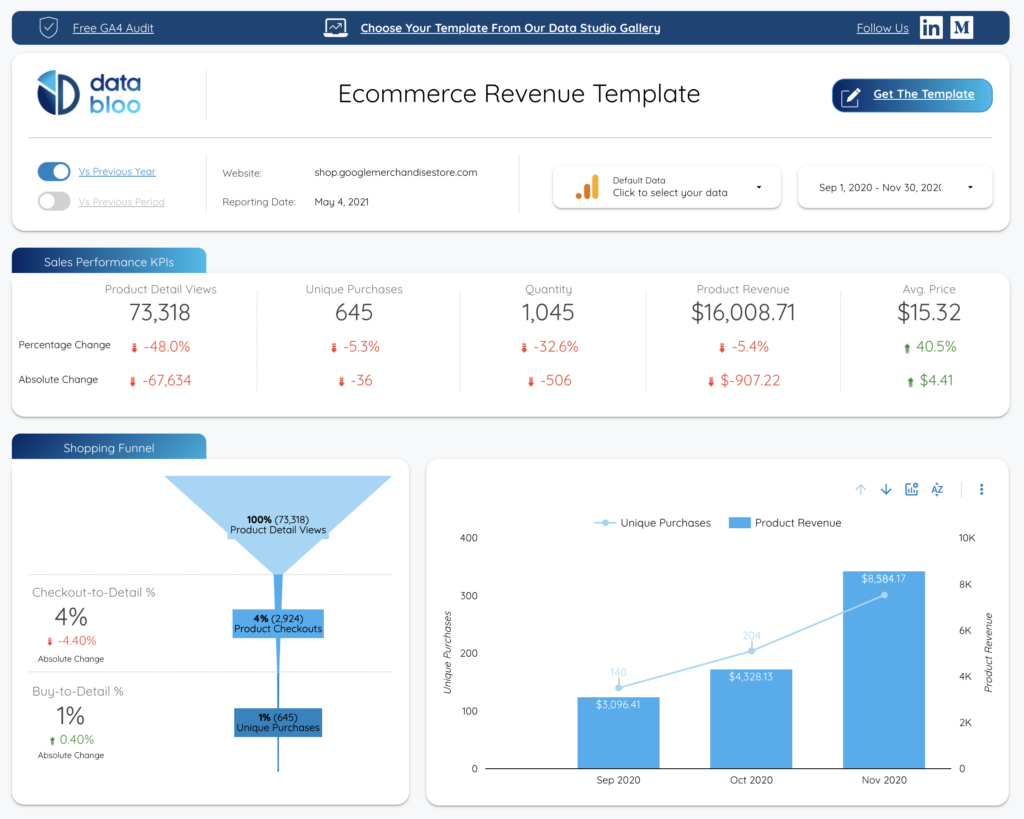
Summary: A great source of inspiration for your ecommerce dashboard. This is built using Google Analytics and isn’t using any other ecommerce data sources. It’s a good source of inspiration but keep in mind that copying the report is disabled, so you’ll need to use it as inspiration not as a direct copy.
Data Source: Google Analytics
Time to Setup: 5 minutes
Ease of Setup: Easy
How to copy a free Data Studio template
The process of copying a template is generally quite easy but it can get a bit tricky if you are changing your underlying data source from one type of data (say Google Analytics) to another type of data like MixPanel or your own custom analytics system.
The basic process looks like this:
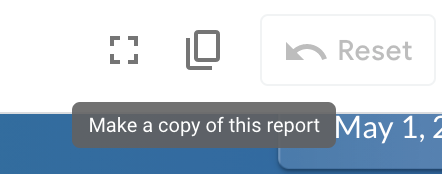
Open your template and navigate to the top right section. You are looking for an icon with two overlaid rectangles.
If you don’t see a header on your page like this screenshot, then simply hover over the top portion of the page and the header should appear.
Note: If you header does not include the double-rectangle icon then copying the report is disabled. You won’t be able to directly copy the report itself, but you can still do your best to replicate the charts and visual styles in your own reports. This isn’t as hard as it sounds and with a bit of practice you should be able to create very similar reports pretty quickly.
After clicking the double-rectangle icon you’ll be prompted to select your new data source.
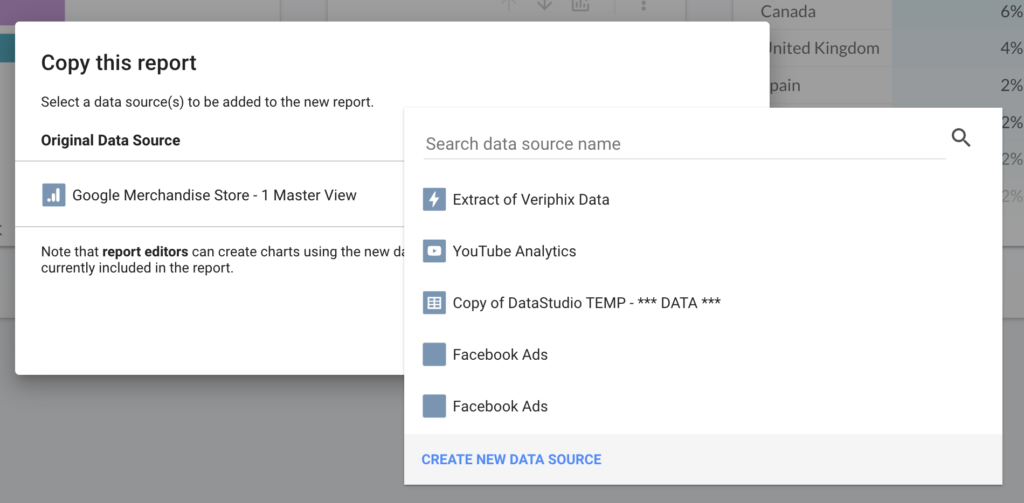
If your data source isn’t included in the dropdown, then select “CREATE NEW DATA SOURCE”
Data Studio will walk you through the process of adding your new data source and once you’ve added it a new copy of your report will be created including your own data.
You might find that your copy doesn’t include all the data you want or that some of the data isn’t available – in this case you can click on the broken charts and add/edit your metrics.
That’s it! In some cases you’ll have your own copy of the report in 5 minutes or less.
Thanks for reading!
If you found this article helpful, please consider using our affiliate link for Supermetrics – they make it incredibly easy to connect all your data to Data Studio